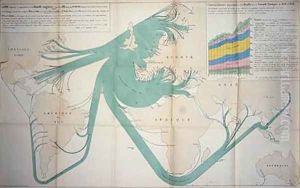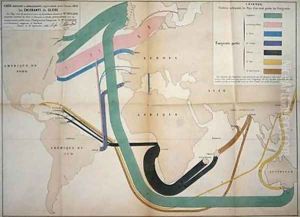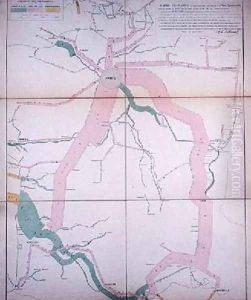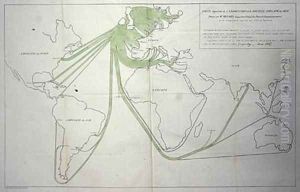


Map showing the export of coal from the British Isles in 1850
-
About Reproduction
Discover the allure of art with our faithful reproduction of "Map showing the export of coal from the British Isles in 1850", originally brought to life by the talented Charles Joseph Minard. Unlike posters or prints, our hand-painted oil painting breathes an unique sense of depth and texture into your space. Every detail, every stroke, and every texture is meticulously recreated, paying the perfect homage to Charles Joseph Minard and his artistic vision.
Owning this piece is more than just decoration - it's a statement of your refined taste in art. Let the vibrant colors and intricate details of this replica serve as a daily reminder of the beauty in our world. Elevate your decor and appreciate the richness of art with our replica of this masterpiece.
-
Painting Description
"Map Showing the Export of Coal from the British Isles in 1850" is a historical graphic representation created by French civil engineer and cartographer Charles Joseph Minard. This particular map, like many of Minard's works, represents a pioneering step in the field of data visualization and infographic.
The map portrays the quantity of coal exported from the British Isles, in 1850, delineated by the lines of varying thickness. They represent the amount of coal transported to different parts of the world. The wider the band, the larger the quantity of coal exported.
The countries receiving the coal exports are clearly marked, with destinations spanning across Europe, the Atlantic, and even as far as Asia. The map thus vividly illustrates the global demand for British coal during the period - a testament to the Industrial Revolution's integral relationship to the exploitation of this fossil fuel.
Minard’s map capitalizes on the use of line width and directions to denote numeric data, an iconic method of representation that provided a new level of detail and understanding of statistical data in the visual form. Minard's map integrates complex geographical and quantitative information, serving as an indicative measure of the scope and scale of global trade during the mid-19th century.
Throughout his career, Minard became renowned for his distinctive capacity to convey dense and difficult statistical data through creative and accessible graphic illustrations. His works, including this map, have been appreciated for both their aesthetic and intellectual components, providing an effective interface between art, cartography, and data analysis.
While the map was created in the mid-19th century, it remains a significant artifact in the study and history of data visualization, cartography, and economic history. Minard's map continues to evoke interest among a wide range of audiences, from historians and geographers to data analysts and graphic designers.
-
Lead Time & Shipping
When you order this oil painting replica, it typically takes 2-3 weeks to paint. If the artwork is more complex, it might need a little more time to ensure the best quality. Once it's ready, we'll send you a photo for your approval. After you give the green light, we'll ship it to you for free.
-
Return & Refund
We believe in the quality of our hand-painted oil painting reproductions, and your satisfaction is our priority. If for any reason, you are not completely satisfied with your purchase, we offer a 45-day return policy. You can return your artwork within 45 days of receipt and receive a full refund. Please note that the artwork must be returned in the original packaging and in the same condition as it was received.


